Course Grades Dashboard
Tableau dashboard used for data exploration of final course grades.
Course Grades Dashboard on Tableau
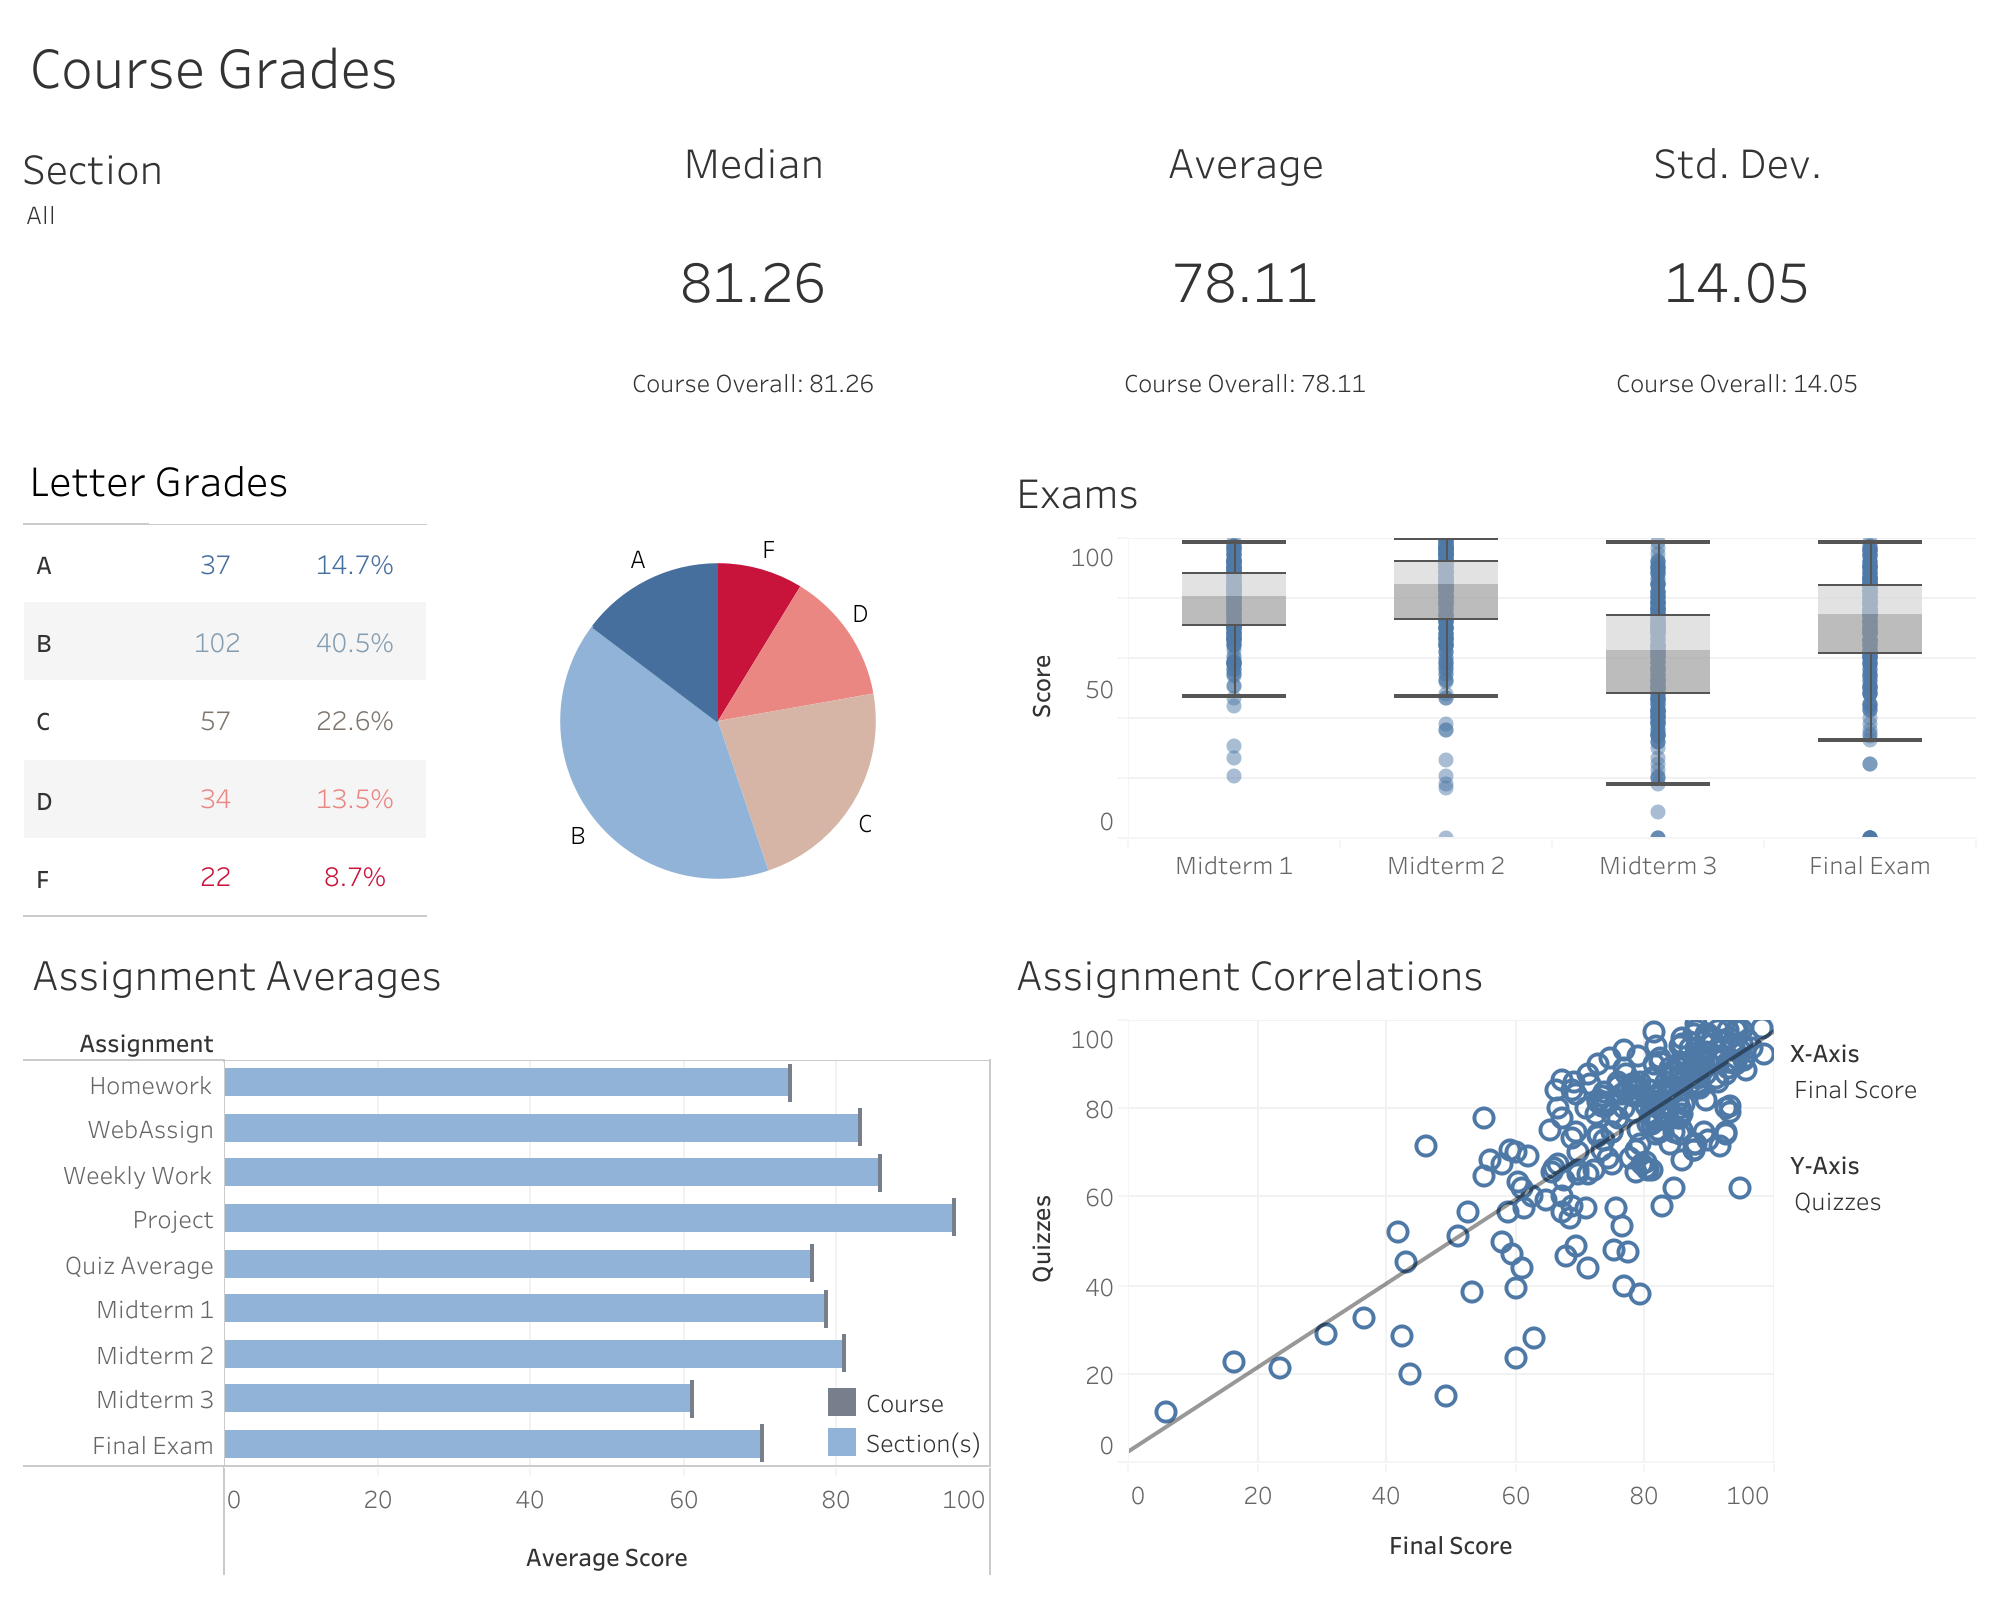
Tableau Data Visualization Data Exploration Presentation
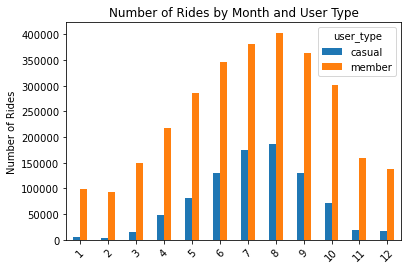
Bike Share Company Customer Usage
This case study was the final assignment in course Google Data Analytics Capstone: Complete a Case Study, the last course in the Google Data Analytics Professional Certificate program.
Bike Share Project on GitHub
Contents:
Python R Data Cleaning Data Analysis Data Visualization Presentation